
KuView
An open-source tool for simplified Kubernetes metric visualization.
This application is specifically crafted to enhance the monitoring of Kubernetes clusters by providing real-time metric visualizations. Within the realm of frontend development, our team crafted an interactive and customizable dashboard within an intuitively designed UI by harnessing React, Prometheus, and Grafana. We also orchestrated the development of API routes and middleware using Express and Node.js. Our application provides engineers valuable insights into resource utilization, application performance, and the overall state of their cluster.
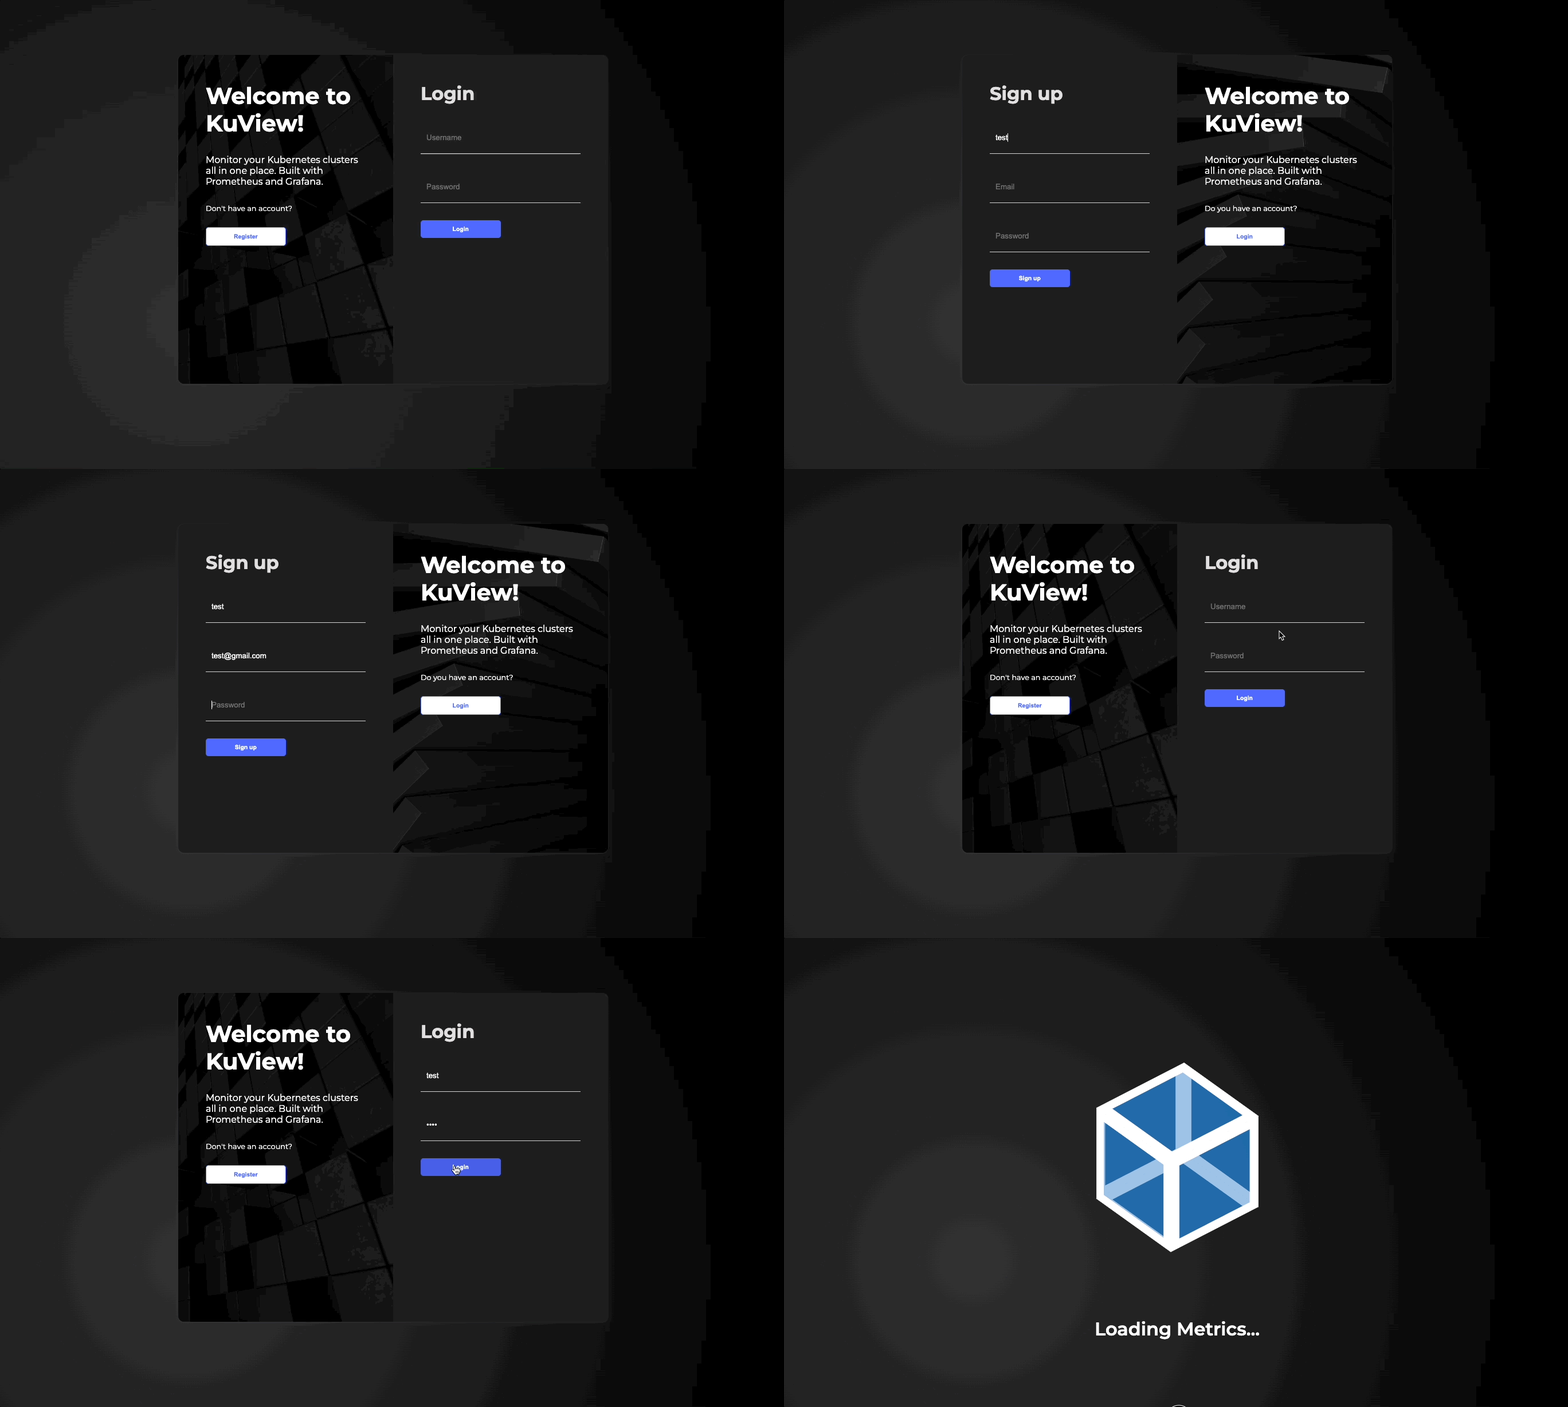
Create a KuView account to monitor your Minikube cluster data
Seamlessly and automatically install on your computer by logging into the browser app
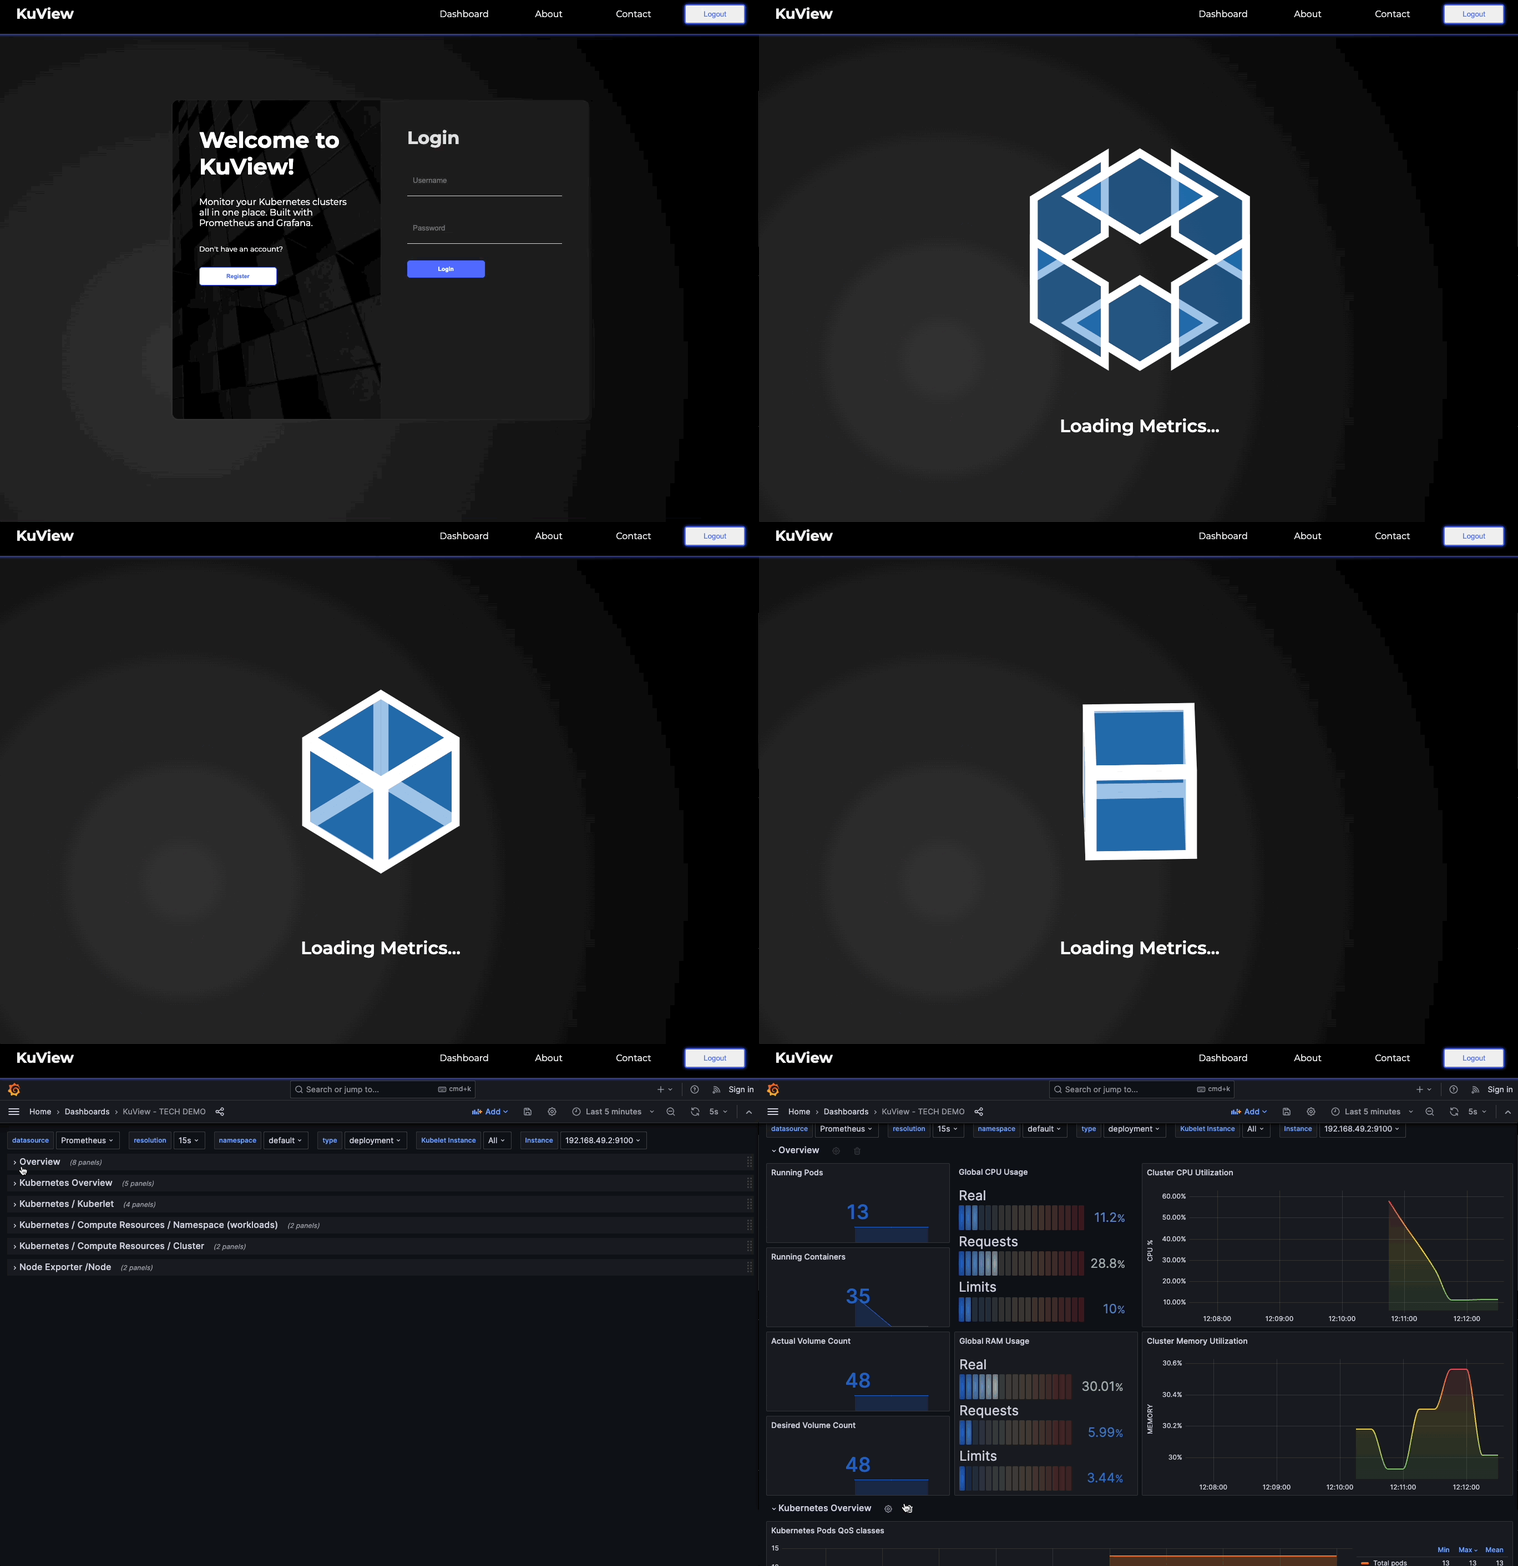
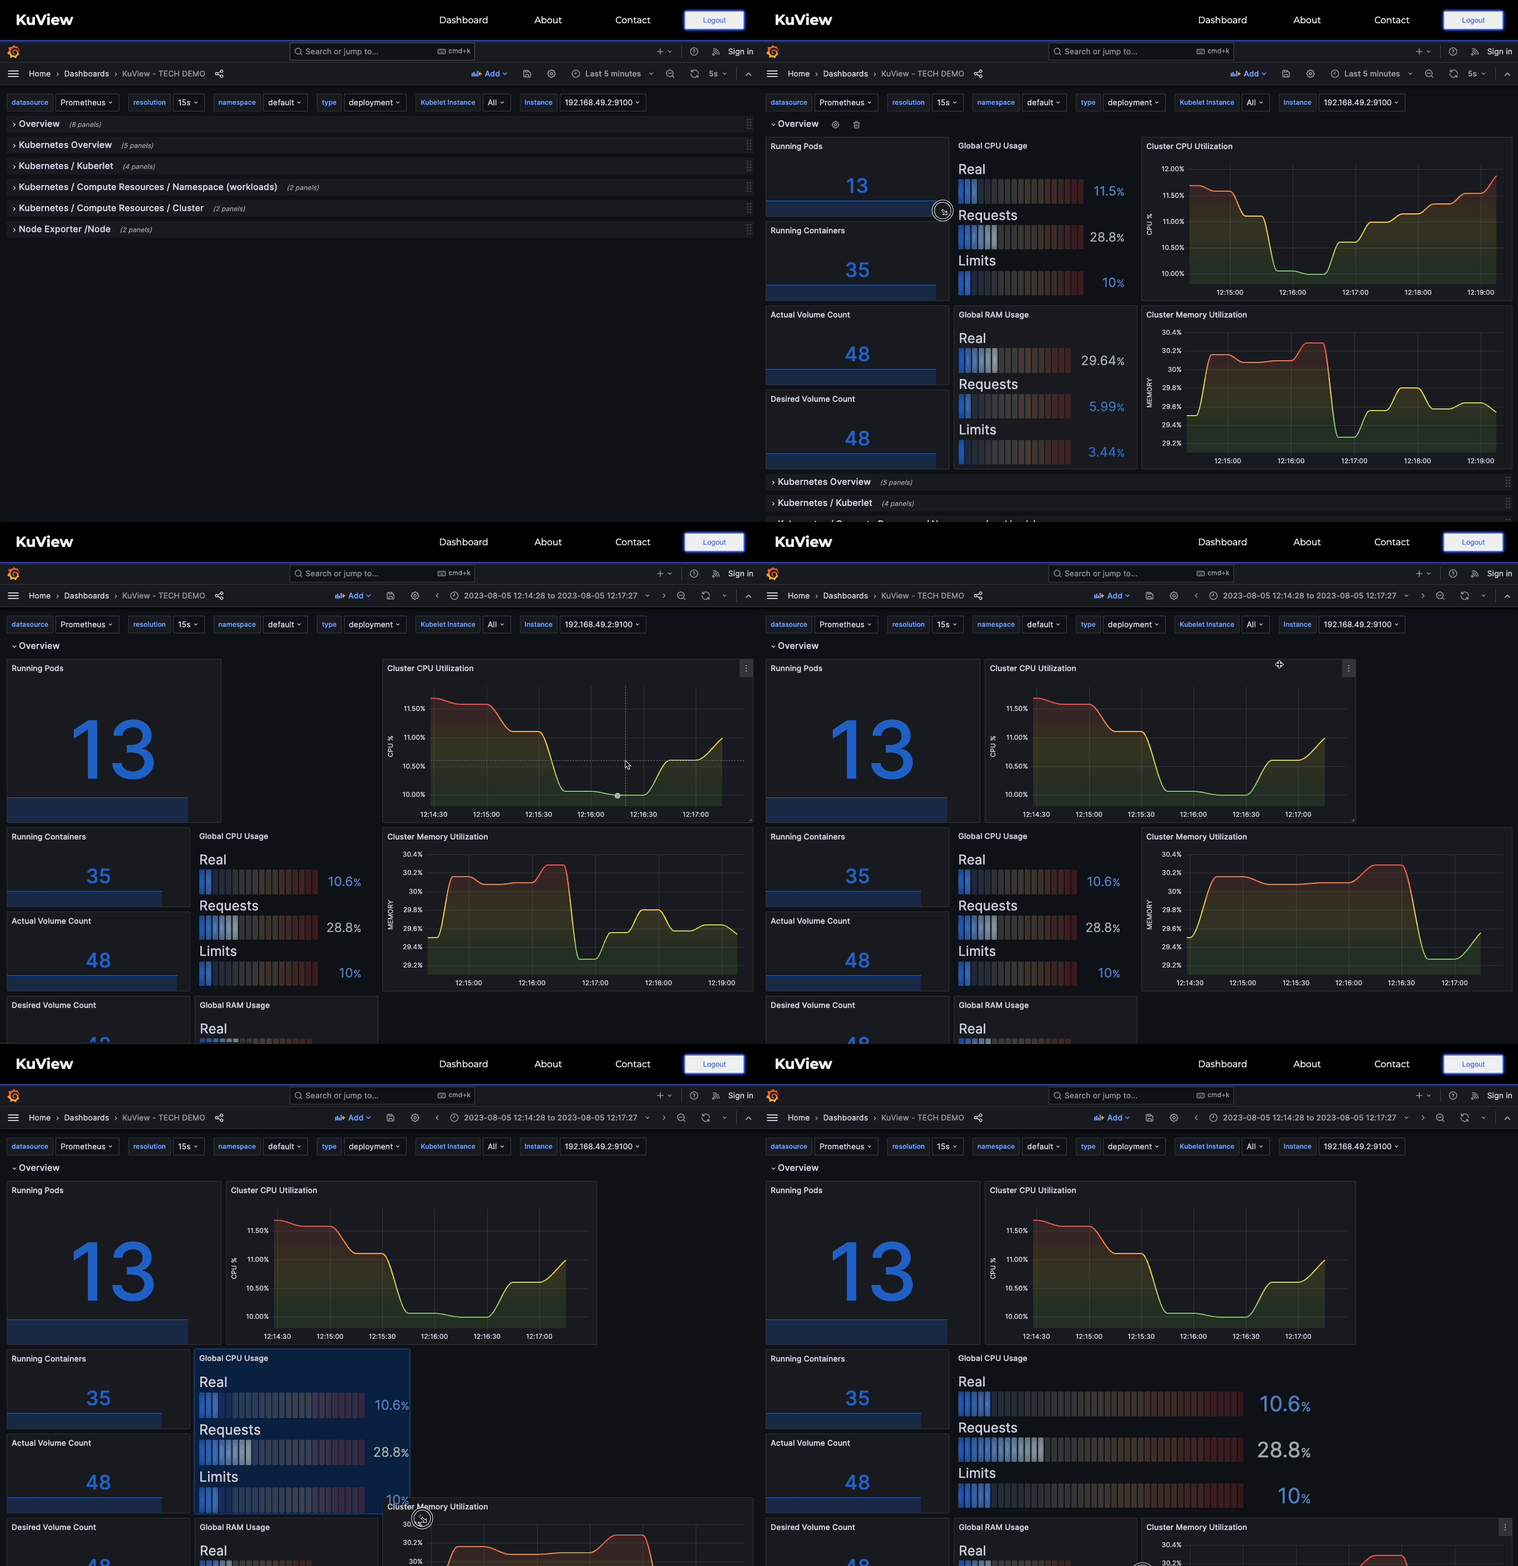
KuView provides you with a customized interactive dashboard to monitor your cluster
As a Software Engineer on KuView, I helped develop the frontend of the Kubernetes monitoring dashboard built with React. I designed and implemented responsive UI components and connected the frontend to backend APIs to visualize real-time cluster metrics. I also contributed to state management, routing, and data flow throughout the application to create a cohesive user experience.
Beyond the frontend, I collaborated on backend development using Node.js, Express, and MongoDB to support dashboard configuration and data management. Working as part of an open-source engineering team, I participated in feature planning, code reviews, debugging, and iterative development to deliver a production-ready tool for monitoring Kubernetes environments.
Tech Talk
In this tech talk, I provide an in-depth overview of testing tools and frameworks, emphasizing the importance of code testing, exploring various testing types and functions, and demonstrating their application through a live demo with the Jest framework.